
Most retention advice starts with a blended average that means little for your category. Here is what good actually looks like by vertical: the twelve strategies that move the number and the two retention leaks almost every store ignores.
Ask most ecommerce teams whether their retention is good, and you get a number without a frame. Then a pause, because nobody knows what it should be.
That is more of a benchmarking problem than a data problem. The figures circulating in retention guides are blended averages that mix grocery brands reordering weekly with furniture brands selling once every six years.
- What Is Ecommerce Customer Retention and How Does It Differ From Acquisition?
- What Is a Good Ecommerce Retention Rate? Benchmarks by Vertical, With Sources
- Listed by Impact: 12 E-commerce Retention Strategies That Will Actually Improve Your Number
- What Are the Two Retention Leaks That Almost No Ecommerce Store Counts?
- How Do You Measure Ecommerce Retention Properly, and Which Metric Decides What?
- What Does an Ecommerce Retention Stack Need and Which Tool Wins Where?
- What Are the 6 Retention Mistakes That Quietly Undo the Work?
- Final Thoughts
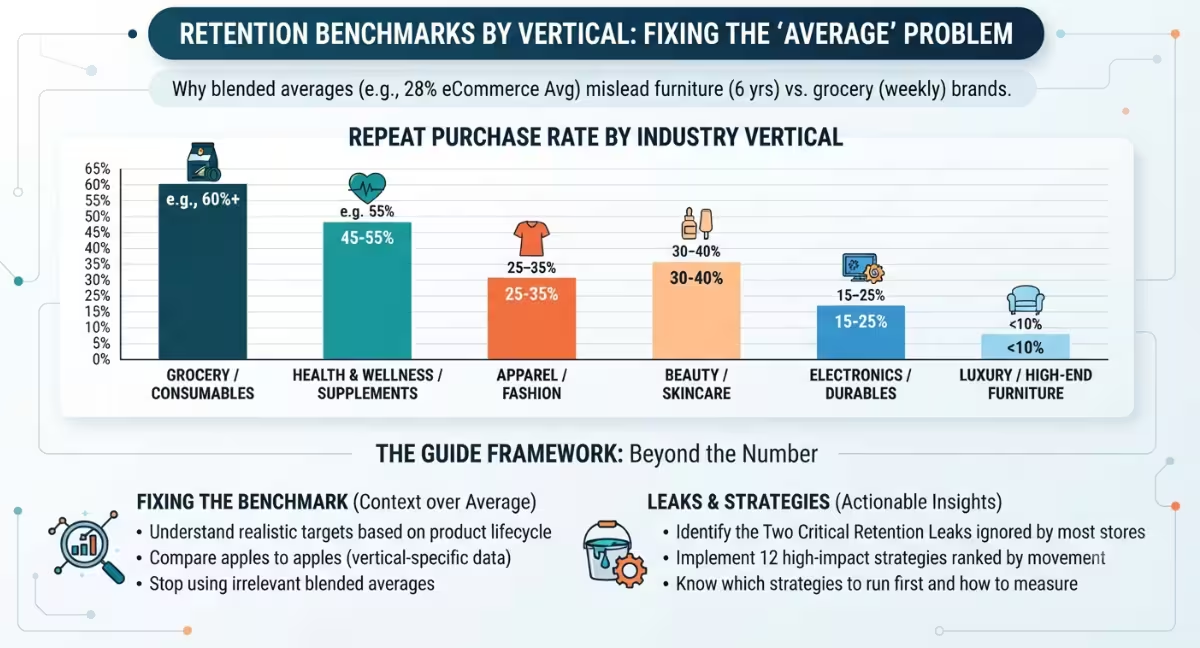
A 30% repeat purchase rate would be a strong year for a fashion label and an alarm for a supplements brand whose customers finish the bottle in thirty days. Until a benchmark has a vertical attached, it is a number, not a benchmark.
The spread is not subtle. The same datasets that put the ecommerce average near 28% put grocery above 60% and luxury below 10%. Comparing yourself to the middle of that range tells you almost nothing.
This guide fixes the frame first, then the tactics: the numbers by category with each source named, twelve strategies ranked by how much they move retention rather than how good they sound in a deck, and the two leaks that cancel out retention gains on most stores. By the end, you will know your realistic target, which three strategies to run first, and how to measure whether they worked.
Ecommerce customer retention in one screen: the numbers, the strategies, and the metric that sets everything
- What it is: The share of customers who buy from you again within a defined period.
- The realistic range: Roughly 25% to 35% twelve-month retention across ecommerce, with the most widely cited average repeat purchase rate sitting near 28%.
- The spread that matters: Subscription and grocery categories retain 60% or more, while luxury fashion sits around 10%. Category beats average every time.
- The three strategies to start with: The first 30 days post-purchase, replenishment timing, and failed-payment recovery.
- The metric that sets every clock: Your median gap between purchases.
Contents
- What is ecommerce customer retention, and how does it differ from acquisition?
- What is a good ecommerce retention rate? Benchmarks by vertical
- Which 12 retention strategies actually move the number?
- What are the two retention leaks almost no store counts?
- How do you measure retention properly?
- What does a retention stack need, and which tool wins where?
- What are the 6 mistakes that quietly undo the work?
- Frequently asked questions
- Where to start: the one number to pull this week
What Is Ecommerce Customer Retention and How Does It Differ From Acquisition?
Ecommerce customer retention is the share of a store's existing customers who make another purchase within a defined period. It is usually measured as customer retention rate or repeat purchase rate, and it differs from acquisition because the customer already knows the brand, so the cost of the next sale is lower.
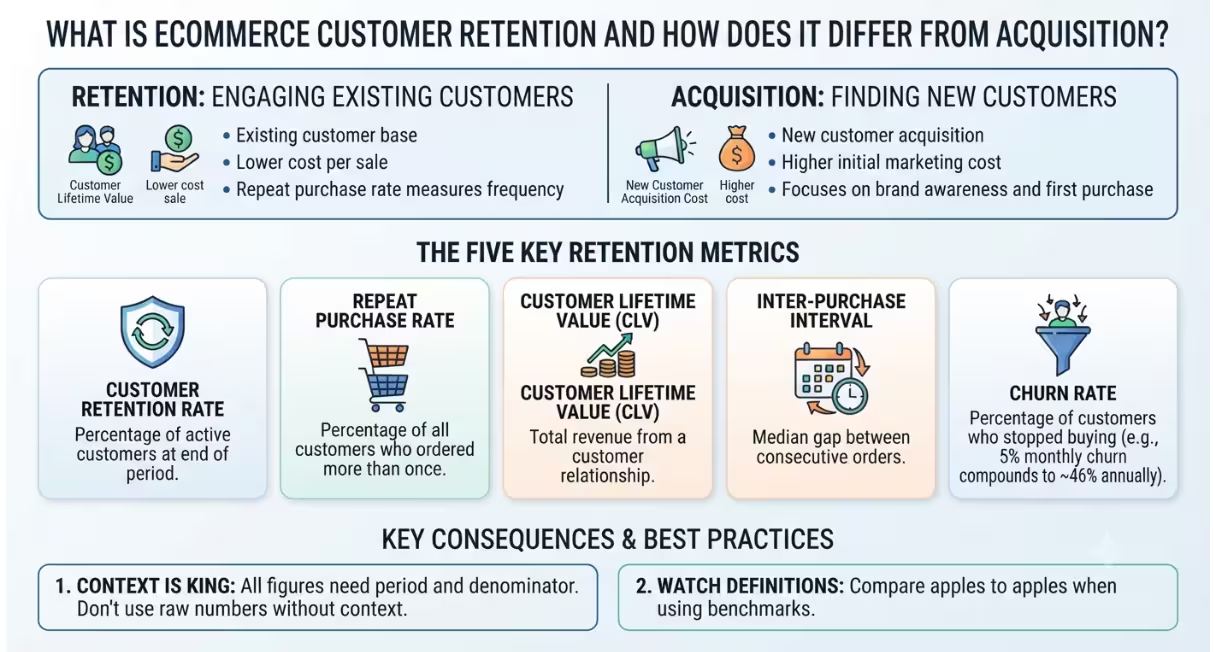
Retention conversations go in circles because five different metrics get used as though they were one. They answer different questions using different denominators.
- Customer retention rate: The percentage of customers still active at the end of a defined period.
- Repeat purchase rate: The percentage of all customers who have ordered more than once.
- Customer lifetime value (CLV): The total revenue a customer generates across the relationship.
- Inter-purchase interval: The median gap between a customer's consecutive orders.
- Churn rate: The percentage of customers who stopped buying. Note that annual churn is not twelve times monthly churn because it compounds. Published subscription analyses point out that 5% monthly churn loses roughly 46% of a cohort over a year, rather than 60%.
Two consequences follow. Any retention figure quoted without its period and denominator is unusable, including your own. And when you compare against a published benchmark, check that the study used your definition, because much of the apparent disagreement between retention studies is definitional rather than real.
What Is a Good Ecommerce Retention Rate? Benchmarks by Vertical, With Sources
The question is unanswerable without a vertical attached. Benchmark against your category rather than the industry, because purchase frequency is set by the product more than by your marketing quality.
Start with the overall figure as a sanity check, then discard it. The most widely repeated average repeat purchase rate in ecommerce is approximately 28%, traced to Metrilo's dataset and reproduced across retention roundups through 2025 and 2026. Shopify has cited overall retention of around 30%.
Against that, Bluecore's analysis of more than 100 major retailers found a lower average repeat purchase rate of approximately 16.5%. Those studies measure different populations with different definitions rather than contradicting each other, which is why the table below matters more than any headline number.
| Category | Typical repeat purchase rate | Purchases per customer per year |
|---|---|---|
| Subscription boxes | 40% to 70%, depending on the study | Recurring |
| Grocery | Around 60% and above | High |
| DTC food and beverage | High relative to most retail | Approximately 3.8 |
| Pet | 30% to 45% | Not reported |
| Beauty and personal care | 22% to 40% | Approximately 2.4 |
| Supplements and health | 15% to 45% | Not reported |
| Fashion and apparel | 25% to 32% | Approximately 2.1 |
| Home and furniture | 18% to 25% | Approximately 1.4 |
| Consumer electronics | 12% to 18% | Approximately 1.6 |
| Luxury | 10% to 22% | Not reported |
The ranges are deliberately wide because the underlying studies disagree. Rivo's 2026 benchmark work, drawing on Opensend's repeat purchase data, puts grocery near 65% and luxury goods near 10%. Finsi's 2026 vertical breakdown places subscription boxes at 40% to 55%, consumables including supplements, food, and pet at 35% to 45%, beauty and skincare at 30% to 40%, mid-market apparel at 25% to 32%, home goods at 18% to 25%, and electronics at 12% to 18%. Where credible sources conflict, the range is the honest answer, and a figure quoted to two decimal places would be false precision.
There are three caveats that make this section actually usable rather than decorative.
- Do not use blended averages; use benchmark cohorts. A store-wide number is a mix of three-year loyalists and last month's discount-driven signups, and they are both moving in totally different directions. Blended retention can hold perfectly flat while two of your newest cohorts completely collapse.
- State the denominator that you are using. Repeat purchase rate, retention rate, and churn are all different calculations on different bases. "Five percent churn" means absolutely nothing until you have stated whether that is monthly or annual, and whether it measures customers or revenue.
- Treat the overall range as your sanity check. It is generally found that stores sit at roughly 25% to 35% twelve-month retention, with an average repeat purchase rate of roughly 28%, and for this reason, that is the field we play on. If your category is already at 45%, then gaining 30% is regarded as underperformance dressed as an industry average, not a target the whole community can aim for.
Build your retention program around one contact database. Brevo's free version provides an estimated 300 email sends a day, together with a selection of signup forms and multistep automation options for up to 2,000 contacts within your automated campaigns, across email, SMS, and push platforms.
Listed by Impact: 12 E-commerce Retention Strategies That Will Actually Improve Your Number
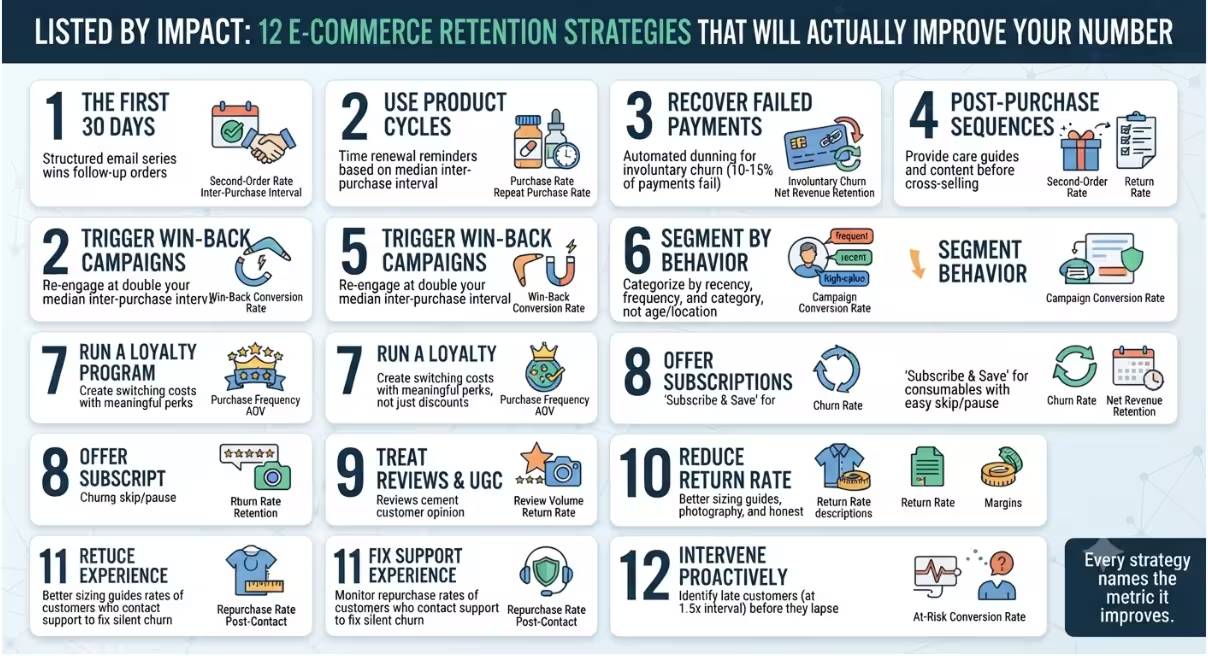
This list is ranked by how much each strategy typically improves retention, not by how easy it is to implement. If your company is starting with a small catalog, say only three products, focus on the first three on this list.
Once you have those working, you can pick up where you left off. Just remember this rule: every strategy names the metric it improves. If retention advice does not have a measure attached to it, ignore it. It is nothing more than inspiration without proper thought.
1. The First 30 Days After a Purchase Are When the Second Order Is Won or Lost
More often than not, a first purchase does not lead to a second purchase later down the line. In fact, it is during the 30 days directly after the first purchase that your customer decides whether they like your store. Finsi performed an analysis in 2026 reporting that brands with a structured email series following a purchase see follow-up orders 20% to 35% higher than those that do not. The mechanism behind the higher results is simply that these brands stay in contact with customers rather than only trying to convince them to buy again. Customers take time while using the product to form an opinion and determine whether your store has earned an appeal as a true brand or is simply a one-time transaction.
Try sending a delivery confirmation email with a realistic date. Product education should reach the customer two to three days after delivery, followed by a specific purchase reason for that product during the first month. These are best used as promotional emails, although the sequence should not be restricted to only three sales emails.
Moves: second-order rate, inter-purchase interval.
2. Use Product Cycles Instead of a Flat Average for Renewal Reminders
Most replacement reminders happen at 30 or 60 days because these are simply round numbers. Instead, take the median inter-purchase interval for that particular product and set your timing around that figure, then send reminders accordingly. For example, with a 60-day serum, you could send a reminder on day 50; a 90-day supplement could trigger one around day 75. A monthly general nudge happens too soon for one product and too late for another. Essentially, these messages become unimportant background noise.
This one measurement can set your replenishment timing, churn window, and win-back trigger, just to name three. Almost no one does the right mathematical calculation to derive it, which may explain why many win-backs are set around 90 days.
Moves: purchase rate, year-one customer value, repeat purchase rate.
3. Recover Failed Payments: The Only Retention Lever That Needs No Persuasion
In retention, this is one of the most underrated levers because persuasion plays no part for these customers. They never leave on their own initiative; it only looks like they have. Churnkey's churn data benchmark states that involuntary churn accounts for 20% to 40% of total churn for customer subscriptions, increasing to as much as 68% for subscription boxes. It also reports that around 10% to 15% of recurring payments fail on the first attempt.
The fact that merchants can recover more than 72% of subscribers at risk by automating dunning and retries makes the numbers clear, according to Recurly's 2024 State of Subscriptions report. It also found that recovery among at-risk subscribers generates 38.3% of LTV and extends a subscriber's median lifetime by an additional 141 days after recovery.
Moves: involuntary churn, net revenue retention.
4. Build Post-Purchase Sequences That Are Not Sales Emails in Disguise
Discounts often account for most of the attention that post-purchase campaigns receive, yet post-purchase engagement remains one of the most underrated opportunities for a brand. Provide detailed care instructions, setup guides for your customers, and a review request after they have had time to use the product. If you want to cross-sell related products, make sure that message does not arrive before message four.
Moves: second-order rate, return rate, review volume.
5. Trigger Win-Back Campaigns on Your Own Interval Instead of a Generic 90 Days
Launching a win-back campaign at 90 days is like throwing a knife blindly into the dark. Take your median inter-purchase interval and then calculate double that value. Consider it your dormancy threshold. A coffee brand may wait two months, while a furniture brand may wait up to three years before considering a customer dormant. By this point, referral options may be more appropriate for furniture brands than the tactics used for shorter-cycle products. When you contact customers, make them aware of what has changed in your brand since their last order rather than leading with discounts. Make sure they are notified and take this approach when your message is unopened.
Moves: win-back conversion rate, reactivation revenue.
6. Segment by Purchase Behavior Rather Than Demographics
Repurchase habits can be predicted more effectively when customers are categorized by recency, frequency, discount sensitivity, and category purchased. This cannot be done as effectively by segmenting customers by age and location. From first-time buyers within a 30-day window to at-risk or lapsed buyers after 30 days, handle at-risk and active buyers using four segments based on purchase behavior, not age or location.
Brevo runs email, SMS, WhatsApp, and push on one contact database that can also hold data for loyalty offers. This makes it possible for your brand to run a retention program without depending on separate loyalty programs or another SMS provider.
Moves: campaign conversion rate, revenue per recipient.
7. Run a Loyalty Program That Creates Switching Costs, Not Just Discounts
Providing a 5% refund through a points scheme in another currency is not meaningful marketing. It is simply a discount presented in a different form. Build loyalty programs around value that customers would forgo by switching to competitors. That value has to be strong enough to matter beyond another discount.
Use tiered experiences to create loyalty or banked points with visible balances. Nordy Club, for example, uses tiers as part of its loyalty strategy. Give customers real perks that they consider worthwhile. Ask them to spend more to unlock limited-edition perks available only to members, or offer early access to restocks and new products when they reach a higher tier. Give them benefits they genuinely want to keep.
Moves: purchase frequency, AOV, repeat purchase rate.
8. Offer Subscription and Repeat-Order Options Where the Product Justifies Them
If you sell consumables, consider a "subscribe and save" option. It removes the need for customers to make the same purchase decision repeatedly and creates a convenient default. This can improve customer retention because subscribers typically churn less than one-time customers. However, make it easy to skip or pause subscriptions so customers retain control and are more willing to subscribe.
Moves: churn rate, net revenue retention.
9. Treat Reviews and UGC as a Retention Mechanism, Not Only Social Proof
Review requests are not just for collecting social proof. By writing a review, customers commit themselves to an opinion about your product, while the feedback shows which items lead to repeat purchases and which quietly result in returns. Ask for reviews after customers have had enough time to use the product, and respond publicly to negative feedback. That is where the retention value truly lies.
Moves: review volume, return rate, second-order rate.
10. Reduce Your Return Rate, Because It Is a Retention Metric in Disguise
Returns masquerade as an operations metric, but they are also a retention indicator, covered in detail in the next section. Simple solutions include better sizing guides, true-color and scale-revealing photography, honest descriptions, and analyzing return reasons monthly instead of yearly. Data from our industry point to sizing, fit, and color issues as major drivers of returns. These are often content challenges, not logistical ones.
Moves: return rate, net revenue retention, margin per customer.
11. Fix the Support Experience That Drives Silent Churn
Most unhappy customers simply leave without complaining. Consequently, they stop purchasing, and this shows up as regular churn on your dashboard. Monitor first-response times, resolution rates, and, most crucially, the repurchase rates of customers who have contacted support. This last metric reveals whether your support team is retaining customers or politely losing them.
Moves: churn rate, repurchase rate post-contact.
12. Intervene Proactively on At-Risk Cohorts Before They Lapse
Once you determine your interval, you can identify late customers before losing them completely. Someone at 1.5 times their usual purchase gap is at risk but still reachable. Reach out with relevance, not urgency. Suggest a restock of a previously purchased item, a new variant in their preferred category, or ask whether anything went wrong.
Moves: at-risk conversion rate, churn rate.
What Are the Two Retention Leaks That Almost No Ecommerce Store Counts?
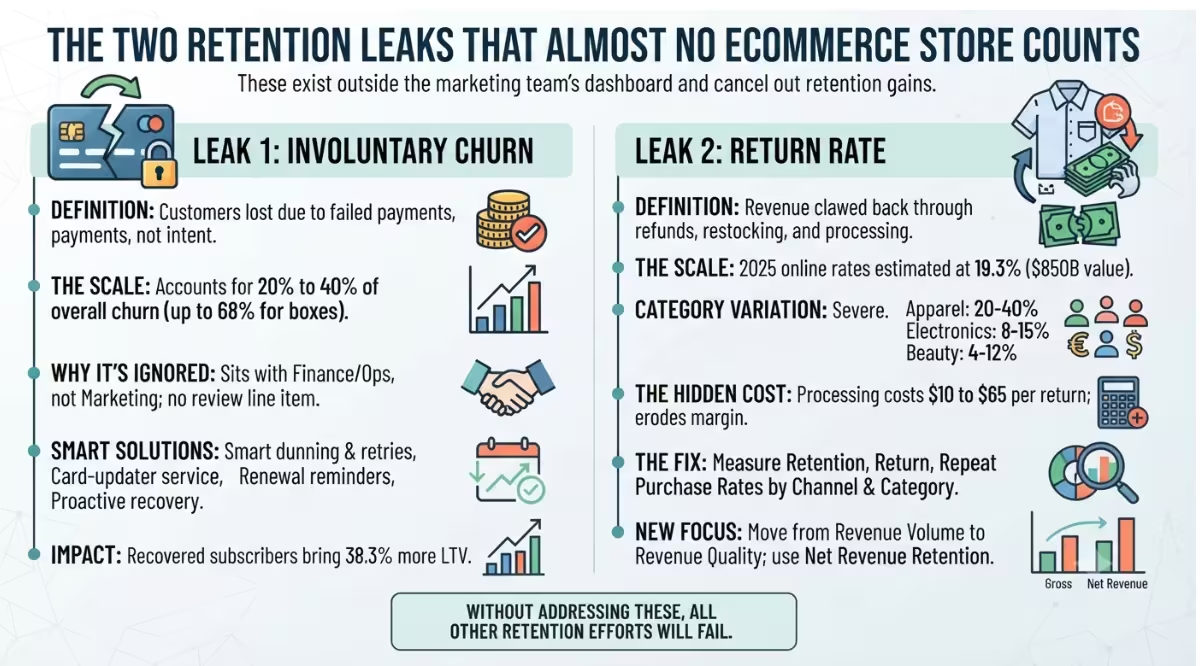
Both exist outside the marketing team's dashboard, which is why they go unfixed. You will not find either on most other strategy lists, and without addressing them, attempts to improve retention through other strategies will fail.
Involuntary Churn: Why Up to a Third of Lost Customers Never Chose to Leave
Separate churn into two categories: voluntary and involuntary. Voluntary churn occurs when a customer deliberately chooses to leave. Involuntary churn occurs when they stop because their credit card fails. The first category reflects dissatisfaction or shifting priorities. The second can stem from an expired card, a bank flag, or a spending limit, implying nothing about the customer's intent to stay.
Churnkey data points to involuntary churn representing between 20% and 40% of overall churn in consumer subscriptions and reaching up to 68% for subscription boxes. Recurly's current network data, updated in July 2026, categorizes these separately by industry and highlights consumer goods and retail subscriptions as some of the highest-churn sectors. While most retention guides comprehensively address persuading churned customers voluntarily, they often overlook involuntary churn, despite it being more cost-effective to fix and requiring no persuasion.
The solution lies in four steps: smart dunning with retries aligned with likely payday schedules rather than stopping after the first decline; a card-updater service; reminders before renewal; and smart recovery before payments actually fail. Recurly's 2024 studies show that recovered subscribers bring 38.3% more lifetime value. This fact can be leveraged with whoever owns billing.
This issue is often ignored because of divisional responsibilities: it sits with Finance or Operations, while retention sits with Marketing. There is no line item for failed payments on anyone's quarterly review, so it remains unaddressed.
Return Rate: How Refunds Quietly Cancel Out the Retention Gains You Just Made
A brand can post a healthy retention rate while its margin erodes underneath it because revenue attributed to loyal customers gets clawed back through returns, restocking, and refund processing. The retention rate does not move, but the finance team still sees the problem.
The scale is documented. In its 2025 Retail Returns Landscape, published in October 2025, the National Retail Federation and Happy Returns estimated online return rates of 19.3% in 2025, versus 17.6% in 2024, compared with an all-channel rate of 15.8%, representing almost $850 billion of merchandise returned. Category variation is severe. Analyses of that data and adjacent research put apparel return rates at 20% to 40%, electronics at roughly 8% to 15%, and beauty at 4% to 12%. Processing estimates from Optoro and Loop Returns commonly land between $10 and $65 per return.
The fix is measurement discipline first. Benchmark retention rate, return rate, and repeat purchase rate separately, then split them by channel of origin and product category. A blended figure hides both the segments where retention is strong and those where returns erase every gain. Discount-acquired cohorts can also show an acceptable repeat purchase rate alongside an unacceptable return rate at the same time, though only the split view makes that clear.
Reframe retention as more than a question of revenue volume; it is also a question of revenue quality. The sharper question is how much incremental revenue returning customers delivered after refunds, return processing, and the incentives used to bring them back. That is where net revenue retention becomes useful.
How Do You Measure Ecommerce Retention Properly, and Which Metric Decides What?
Each metric has a utility: a useful question it answers and a decision it influences. A metric that changes no decision does not deserve a place, so identifying which decision each metric supports is important.
| Category | Typical repeat purchase rate | Purchases per customer per year |
|---|---|---|
| Subscription boxes | 40% to 70%, depending on the study | Recurring |
| Grocery | Around 60% and above | High |
| DTC food and beverage | High relative to most retail | Approximately 3.8 |
| Pet | 30% to 45% | Not reported |
| Beauty and personal care | 22% to 40% | Approximately 2.4 |
| Supplements and health | 15% to 45% | Not reported |
| Fashion and apparel | 25% to 32% | Approximately 2.1 |
| Home and furniture | 18% to 25% | Approximately 1.4 |
| Consumer electronics | 12% to 18% | Approximately 1.6 |
| Luxury | 10% to 22% | Not reported |
Cohort analysis makes the remainder trustworthy. Group customers by month of their first purchase and follow each cohort over time. Your January cohort retaining at 34% might contrast sharply with your November cohort at 19%, even though a blended number shows no change. That leaves the key questions unanswered: Is the retention work compounding, quietly failing, or producing real improvements? According to Finsi's 2026 guidance, later cohorts should show higher repeat purchase rates if the retention work is producing meaningful results.
Most stores do not need all seven metrics listed above, and attempting to instrument all of them can turn into a measurement project of its own. Start with repeat purchase rate, inter-purchase interval, and CLV by cohort before adding other measures as required. Add churn splits when you launch subscriptions and return rate by channel when you scale paid acquisition.
What Does an Ecommerce Retention Stack Need and Which Tool Wins Where?
A retention stack needs four areas covered: lifecycle messaging across your channels, a loyalty or subscription layer, review collection, and billing recovery if you offer subscriptions. However, it does not need a different vendor for each of these. There are three clear winners in specific scenarios, and pretending otherwise would not help you make the best choice.
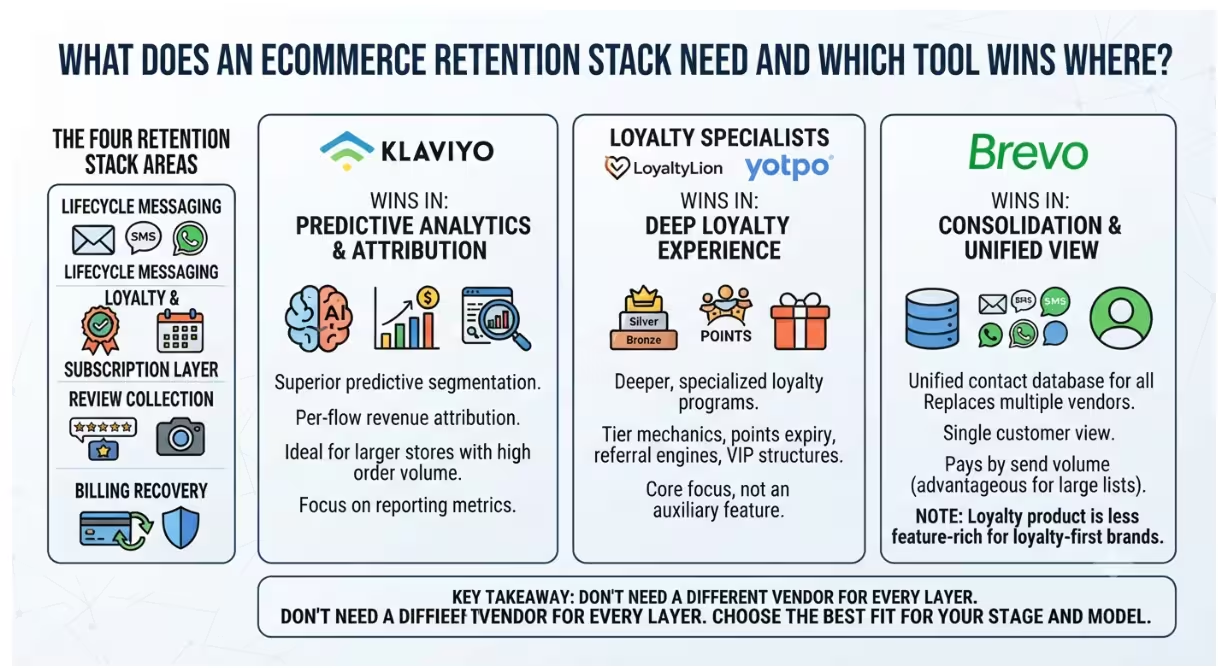
Klaviyo has the upper hand in predictive segmentation and per-flow revenue attribution for larger stores with sufficient order volume for its predictive models to generate meaningful data. If your retention program relies heavily on analytics and attribution per flow is the reporting metric you are judged on, this capability offers a significant advantage.
LoyaltyLion and Yotpo offer a deeper loyalty experience than any all-in-one platform such as Brevo. Tier mechanics, points expiry rules, referral engines, and VIP structures are their core focus rather than just one component within a larger software suite.
Dedicated dunning tools are more effective at subscription billing recovery than any marketing platform because retry logic, card updaters, and decline-code handling require specialized engineering. No ESP can perform these tasks as proficiently as a purpose-built tool.
Brevo offers consolidation rather than depth as its primary advantage. With email, SMS, WhatsApp, push notifications, and an integrated loyalty product all running from a unified contact database, two vendor solutions can be replaced for stores that do not need best-in-class depth at every layer and would prefer a single customer view over three separate ones. Additionally, paying by send volume instead of contact count is advantageous for stores that maintain a large list but email selectively.
It is important to acknowledge one limitation: Brevo's loyalty product is not the most feature-rich on the market, and a brand whose primary commercial driver is loyalty rather than an auxiliary function will invariably find it too limited. If the business model is defined by the loyalty program, invest in a dedicated specialist.
What Are the 6 Retention Mistakes That Quietly Undo the Work?
- Benchmarking against a blended industry average. You should attach a vertical to give the figure context; otherwise, it is meaningless noise.
- Discounting your way to repeat purchases. This trains customers to wait for price drops and erodes the margin that retention was supposed to protect.
- Running on generic 90-day win-back triggers. Your own inter-purchase interval should dictate the timing.
- Ignoring failed payments. Published benchmarks reveal that up to a third or more of subscription churn can be attributed to customers who never intended to cancel.
- Treating return rate as an operations or logistics metric. It is actually an important retention metric disguised as something else.
- Measuring blended LTV. It has to be measured by cohort, or the number tells you very little.
Final Thoughts
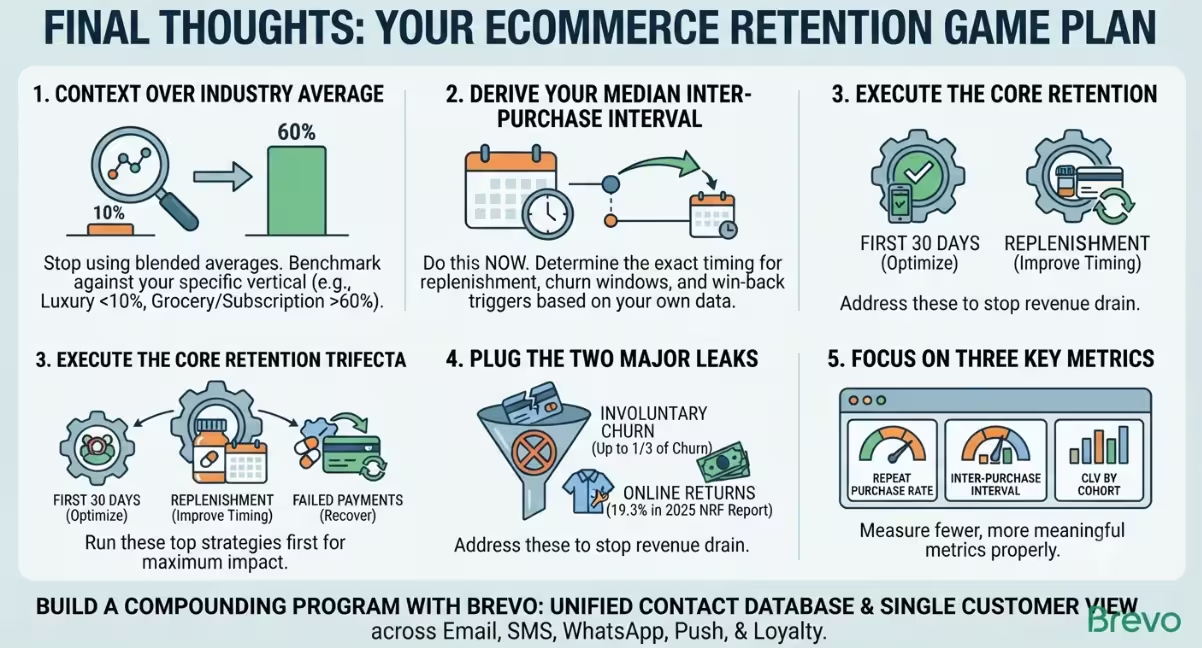
Benchmark against your vertical, not the industry. Context matters when the published spread ranges from roughly 10% for luxury to more than 60% for grocery and subscription. Derive your median inter-purchase interval this week. That determines replenishment timing, your churn window, and your win-back trigger. It gives you practical information for deciding when to expect customers back and when to nudge them.
Run the top three strategies first: optimizing the first 30 days, improving replenishment timing, and recovering failed payments will address three of the most lucrative opportunities for improving retention. Plug the two major leaks next. Involuntary churn causes one-third of all churn or more in some published subscription benchmarks, while online returns reached 19.3% in the NRF and Happy Returns 2025 report. Measure three things properly, not seven poorly: repeat purchase rate, inter-purchase interval, and CLV by cohort.
Pull your median inter-purchase interval this week and split it by your top product categories for more insight. Every timing decision in this guide starts there, and until you have it, every decision about replenishment, dormancy, and cadence remains a guess. It is one query against your own order history, and it can change what you build next. Ready to build a retention program that compounds?
Brevo brings email, SMS, WhatsApp, push notifications, and loyalty together on one contact database, allowing lifecycle messaging to run from a single customer view.


